FFT Fast Fourier Transform

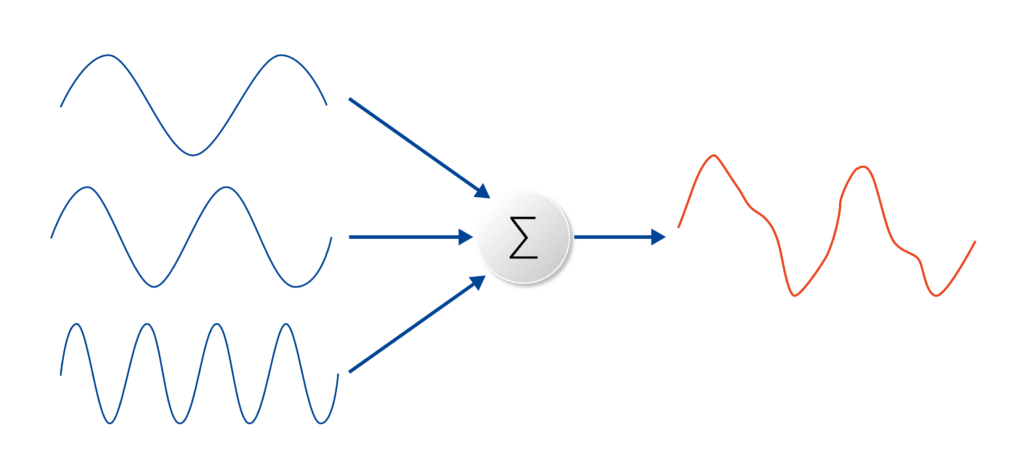
FFT Fast Fourier Transform allows the decomposition of signals into their constituent sinusoids, enabling analysis in the frequency domain.

What is FFT Fast Fourier Transform?

The FFT Fast Fourier Transform is an algorithm used to compute the discrete Fourier transform (DFT) and its inverse more efficiently. The DFT is a transform used in signal processing and image processing, among many other areas, to transform a discrete signal into its frequency domain representation. The FFT speeds up the computation process of the DFT, allowing it to be used in real-time applications and for large datasets.

Who invented FFT?

The FFT was co-discovered by James W. Cooley and John W. Tukey in 1965. While the algorithm was certainly a breakthrough, it should be noted that many of its foundational ideas had been around for some time, but Cooley and Tukey’s work brought it to prominence in the digital age, especially with the rise of digital computing. Their version of the algorithm greatly reduced the computational complexity of processing large datasets, making digital signal processing more feasible and efficient.

FFT Fast Fourier Transform

The FFT is an optimized algorithm designed to quickly compute the Discrete Fourier Transform (DFT) and its inverse. The advantage of the FFT lies in its efficiency. While a direct computation of the DFT requires O(N^2) operations (quadratic time), the FFT algorithm allows the same computation in O(N log N) operations, which is a significant speedup for large data sets.

The FFT (Fast Fourier Transform) algorithm is used in a wide range of applications because it can convert a signal from its time domain to its frequency domain, and vice versa. Understanding the frequency components of a signal can provide valuable insights into the nature, behavior, and properties of that signal.

What is the FFT equation?

The FFT is an algorithm that efficiently computes the DFT, so the equation is the same as the DFT equation. However, it’s worth noting that there are many different FFT algorithms (e.g., radix-2, split-radix, etc.), and each one has its own specific steps and intricacies.

FFT algorithm

What is the DFT?

DFT Discrete Fourier Transform is a powerful mathematical tool used to transform discrete, periodic signals from their time-domain representation to a frequency-domain representation. This allows for analysis and manipulation in the frequency domain before potentially transforming back to the time domain with the inverse DFT. The DFT, which the FFT computes efficiently, is defined for a sequence x[n] of length N as:
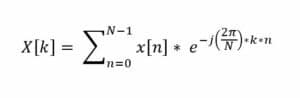
FFT Fast Fourier Transform Formula

Where:

  • X[k] is the k-th element of the frequency-domain representation.
  • x[n] is the n-th element of the time-domain signal.

e is the base of the natural logarithm (approximately equal to 2.71828).

  • j is the imaginary unit (satisfying j2=−1).
fft application

What are FFT Applications?

There are many FFT applications:

  • Applied Mechanics (e.g. Structural dynamics, Aircraft wing-flutter suppression, Machinery dynamics diagnostics, Nuclear power plant modeling, Vibration analysis)
  • Sound and Acoustics (e.g. Acoustic imaging, Passive sonar, Ultrasonic transducers, Array processing, Architecture acoustic measurement, Music synthesis)
  • Biomedical Engineering (e.g. Diagnosis of airway obstruction, Muscle fatigue monitoring, Assessing heart valve damage, Tissue structure characterization, Gastric disturbances investigation, Cardiac patient diagnosis, EEG data compression, Artery dynamics investigation)
  • Numerical Methods (e.g. High-speed interpolation, Conjugate gradient method, Boundary value problems, Riccati and Dirichlet equations, Rayleigh’s integral, Wiener-Hopf integral equation, Diffusion equation, Numerical integration, Karhunen-Loeve transform, Elliptic differential equations)
  • Signal Processing (e.g. Matched filters, Deconvolution, Real-time spectral analysis, Cepstrum analysis, Coherence function estimation, Speech synthesis and recognition, Random process generation, Transfer function estimation, Echo/reverberation removal)
  • Instrumentation (e.g. Chromatography, Microscopy, Spectroscopy, X-ray diffraction, Electrocardiography)
  • Radar (Cross-section measurement, Moving target indicator, Synthetic aperture, Doppler processor, Pulse compression, Clutter rejection)
  • Electromagnetics (Microstrip line propagation, Conducting bodies scattering, Antenna radiation patterns, Dielectric substrate capacitance, Phased-array antenna analysis, Time-domain reflectometry, Waveguide analysis, Network analysis)
  • Communications (Systems analysis, Trans-multiplexers, Demodulators, Speech scrambler system, Multichannel filtering, M-ary signaling, Signal detection, High-speed digital filters, Voice coding systems, Video bandwidth compression)
  • Miscellaneous (e.g. Magnetometers, Metallurgy, Electrical power systems, Image restoration, Nonlinear system analysis, Geophysics, GaAs FET transient response, Integrated circuit modeling, Quality control)

What are the benefits of using FFT?

There are many benefits of using FFT in various applications:

  1. Signal Analysis: By converting a time-domain signal to its frequency components, users can identify the dominant frequencies present in a signal, detect any unwanted noise, or analyze harmonics.
  2. Noise Reduction: In audio or image processing, unwanted frequencies (noise) can be identified and removed by manipulating the frequency components and converting the signal back to the time domain.
  3. Compression: In digital signal processing, the frequency representation of a signal can sometimes be compressed by preserving only the most significant frequencies, which can be especially useful in image and audio compression techniques.
  4. Filter Design and Implementation: Filters can be designed and implemented more efficiently in the frequency domain. By converting a signal to its frequency representation, certain frequency components can be amplified, attenuated, or eliminated, and then transformed back to the time domain.
  5. Convolution: Convolution in the time domain is multiplication in the frequency domain. Computing convolution using FFT (by converting to the frequency domain, multiplying, and then converting back) can be faster than direct time-domain convolution for long signals.
  6. Spectral Analysis: In fields like astronomy, geology, and oceanography, analyzing the frequency components of signals can provide insights into physical phenomena.
  7. Structural Analysis: In civil engineering, FFT can be used to analyze the vibrational response of structures, helping engineers detect resonant frequencies that could be harmful to the structure.
  8. Telecommunication: FFT is used in modulating signals for transmission and in demodulating them upon receipt.
  9. Audio Processing: FFT helps in equalization, reverb, pitch correction, and many other audio effects by analyzing and manipulating signals in the frequency domain.
  10. Medical Imaging: In MRI (Magnetic Resonance Imaging), the FFT is used to transform the signals received from the body into images.

What is the difference between FFT and Fourier Transform?

Fourier Transform is a broader mathematical concept used to transform signals between time (or spatial) and frequency domains, the Fast Fourier Transform is a specific, optimized algorithm to compute the DFT, which is the sampled version of FT, in a faster manner.

How does the Fourier Transform work?

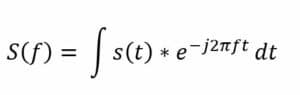
The Fourier transform decomposes a waveform into a sum of sinusoids of different frequencies. This means that the Fourier transform represents the same information as the original waveform, just in the frequency domain (as opposed to the time domain). The methodology of Fourier transform analysis is essential for effective problem-solving in many engineering and scientific contexts. Visually, the Fourier transform is represented by a diagram indicating the amplitude and frequency of each sinusoid. The equation below represents the continuous-time Fourier transform. The equation captures how any continuous-time signal can be represented as a sum (integral) of sinusoids of all possible frequencies:

Continuous Fourier Transform Equation

Where:

  • S(f) represents the Fourier transform of s(t).
  • e is the base of the natural logarithm.
  • j is the imaginary unit (with j2=−1).

Is FFT done in real time or is it post-processing?

The Fast Fourier Transform (FFT) can be applied in both real-time and post-processing contexts. The distinction between the two primarily depends on the application and the specific requirements of the task at hand.

  • Real-Time FFT:
    • Applications: Real-time FFT is used in applications where immediate frequency-domain information is required. Examples include real-time spectrum analyzers, audio effects processing (like real-time equalizers), certain telecommunications applications, and active noise control.
    • Challenges: Performing FFT in real-time requires fast hardware and optimized algorithms, especially when the data rate is high or the FFT size is large. Latency can be a critical factor in real-time applications, so the system must be designed to handle the data within the time constraints.
    • Benefits: Real-time processing can provide immediate feedback, which is essential in certain applications like audio processing, live monitoring systems, or active control systems.
  • Post-Processing FFT:
    • Applications: Post-processing is typically employed when there’s no immediate need for the transformed data, or when more complex and computationally intensive analysis is required. Examples include vibration analysis of machinery (where data is collected over time and then analyzed), research studies, and certain image processing tasks.
    • Challenges: While there might not be the same time constraints as in real-time processing, post-processing can involve handling large datasets, requiring efficient storage and retrieval mechanisms.
    • Benefits: Without the constraint of time, more detailed or comprehensive analysis can be done. Data can be re-analyzed with different parameters, algorithms, or models as needed.

How to measure FFT?

Measuring the FFT (Fast Fourier Transform) involves capturing a time-domain signal and then transforming it into the frequency domain to analyze its frequency components. Here’s a basic step-by-step guide on how to measure FFT:

  1. Signal Acquisition:
    • Input Signal: Ensure that the signal of interest, be it from a microphone, vibration sensor, or any other source, is accessible for measurement.
    • Sampling: Digitally sample the signal using an Analog to Digital Converter (ADC). The sampling rate should be at least twice the highest frequency component in the signal (as per the Nyquist theorem) to avoid aliasing.
  2. Windowing (Optional but Recommended):
    • Before applying the FFT, it’s often a good idea to apply a window function to the time-domain signal. This can minimize spectral leakage, which can occur due to the finite length of the sampled signal. Common window functions include Hanning, Hamming, Blackman, and Kaiser.
  3. Apply the FFT Algorithm:
    • Using either dedicated hardware (like a Digital Signal Processor) or software (like MATLAB, Python’s numpy library, or other FFT libraries), transform the windowed time-domain signal into the frequency domain.
  4. Analyze the Result:
    • The output of the FFT will be a complex array, with both magnitude and phase information. For many applications, only the magnitude is of interest.
    • The magnitude spectrum will show the amplitude of the signal’s frequency components.
    • You can determine the dominant frequencies in the signal by identifying peaks in the magnitude spectrum.
  5. Resolution and Size:
    • The frequency resolution of the FFT is determined by the sampling rate divided by the number of points in the FFT. For instance, if you sampled a signal at 1kHz and used a 1,000-point FFT, your frequency resolution would be 1Hz.
    • Using a larger FFT size will give you better frequency resolution but will require more computation.
  6. Inverse FFT (IFFT):
    • If required, you can transform the frequency-domain data back into the time domain using the Inverse Fast Fourier Transform (IFFT).
  7. Visualization:
    • Display the frequency spectrum using software or dedicated display hardware. Visualization helps in understanding the frequency components and their respective amplitudes.
  8. Log or Save Data (if necessary):
    • Depending on the application, you might need to log or save the frequency data for further analysis or for record-keeping.
  9. Post-Processing:
    • Further processing like filtering, spectral averaging, or harmonics analysis might be required depending on the application.

What are FFT Equipment and Tools?

To measure FFT, you might use various equipment and tools:

    • A digital oscilloscope with FFT functionality.
    • A dedicated spectrum analyzer such as Svantek
    • Data acquisition systems with software tools for FFT analysis.
    • Software tools like MATLAB, LabVIEW, or Python-based tools for data analysis.
What is FFT Analyser

What is FFT Analyser?

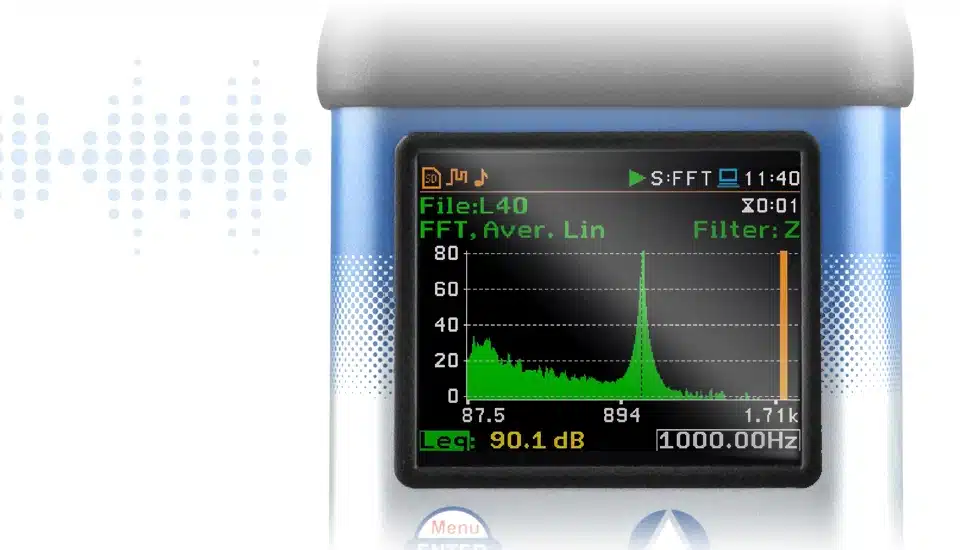
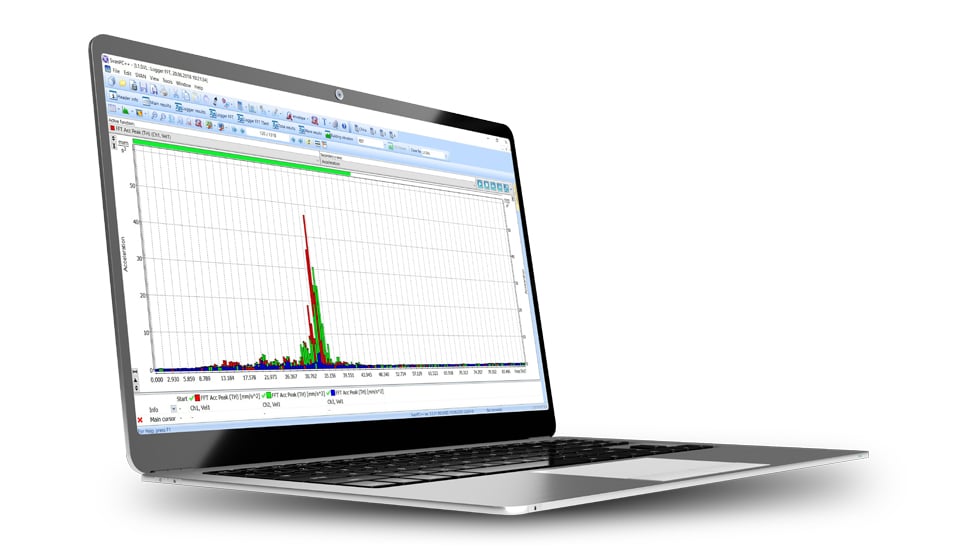
An FFT analyzer, or Fast Fourier Transform analyzer, is a device that provides frequency analysis of signals, commonly used in audio, vibration studies, and various other applications. It uses the FFT algorithm to transform a signal from its original time domain into the frequency domain. Here’s a more detailed breakdown of what an FFT analyzer does:

  1. Time to Frequency Domain Conversion: The primary function of an FFT analyzer is to take a time-domain signal (like a recording of audio) and convert it into its frequency-domain representation. This allows users to see which frequencies are present in the signal and at what intensities.
  2. Resolution: FFT analyzers provide a spectrum view where signals are represented in terms of their constituent frequencies. The resolution of this spectrum can vary based on the settings, especially the number of FFT points or “lines”.
  3. Filtering and Weighting: Most FFT analyzers allow users to apply different filters and weightings to the input signal. This is especially relevant in applications like audio analysis, where the A, B, C, or Z-weighting filters can be applied to mimic the human ear’s response to different frequencies.
  4. Windowing: To mitigate the effects of processing finite chunks of data (which can introduce artifacts into the frequency analysis), FFT analyzers use various window functions like Hanning, Rectangle, Flat Top, or Kaiser-Bessel.
  5. Applications: FFT analyzers are utilized in a variety of fields, including acoustics (to analyze sound or noise signals), vibration analysis (to determine the frequencies at which structures or machines might resonate), and telecommunications (to analyze the frequency content of signals).
  6. Real-time Analysis: Modern FFT analyzers can provide real-time frequency analysis, allowing users to view the frequency content of signals as they change over time.
  7. Hardware & Software: FFT analyzers can be standalone hardware devices, often with specialized input circuitry to handle various types of signals. They can also be software applications running on standard computers, using digitized input from sound cards or other input devices.a

What is a Spectral Leakage?

Spectral Leakage is a phenomenon that can skew the results of an FFT analysis. When performing an FFT, there’s an inherent assumption that the signal in the time record repeats indefinitely. However, this assumption is violated if the number of cycles of the signal in that record is not a whole number (nonintegral). This discrepancy between the assumed repetition and the actual signal can lead to spectral leakage. Spectral leakage can smear the energy from a specific frequency across adjacent frequency lines or bins, making the result less accurate.

What is Anti-Aliasing and Nyquist Frequency in Relation to FFT?

Both anti-aliasing and the Nyquist frequency are crucial concepts to understand when sampling signals and performing FFT (Fast Fourier Transform) analyses:

  • The Nyquist Frequency defines the maximum frequency that can be accurately sampled and later reconstructed. To capture all the details of a signal, one must sample at least twice the highest frequency present in that signal.
  • Anti-aliasings a technique to prevent the incorrect representation of high frequencies as lower frequencies in sampled data. An anti-aliasing filter ensures that only frequencies below the Nyquist frequency are present in the sampled signal, thus safeguarding the integrity of the signal’s frequency content in the context of FFT and other digital signal processing techniques.

Why is Nyquist Frequency Important?

When sampling a continuous signal to obtain a discrete signal for digital processing (like FFT), the Nyquist theorem (or Shannon-Nyquist sampling theorem) states that the sampling frequency must be at least twice the highest frequency present in the signal to be able to fully represent and later reconstruct the original continuous signal without any loss of information. The highest allowable frequency in the signal, which is half the sampling rate, is the Nyquist frequency. Mathematically, if fS​ is the sampling frequency, the Nyquist frequency fN​ is: fN​=fS/2​​

How does Anti-Aliasing Work?

To prevent aliasing, an anti-aliasing filter is employed. This filter is an analog low-pass filter applied to the signal before sampling. Its purpose is to attenuate or eliminate frequencies in the signal that are higher than the Nyquist frequency, thus ensuring that the sampled version of the signal doesn’t contain misleading frequency information. By doing so, it ensures that the discrete version of the signal is a true representation of the continuous signal up to the Nyquist frequency.

In the context of FFT: When performing an FFT on sampled data, if the data has not been sampled correctly (i.e., at a high enough rate) or if an appropriate anti-aliasing filter hasn’t been applied, the resulting frequency spectrum can contain aliased frequencies. This can lead to incorrect or misleading interpretations of the signal’s frequency content.

Averaging of FFT Spectra

Averaging in the context of FFT is used to enhance the signal-to-noise ratio and provide a more accurate representation of the spectrum, especially when analyzing non-periodic signals like noise or music.

  1. The classical mean: As the text describes, a certain number of FFTs are captured and then averaged. Each FFT result contributes equally to the final averaged spectrum. This method is particularly suitable for situations where the signal has a defined duration, and the objective is to get an average representation over that duration.
  2. The exponential mean: This is a type of “weighted” average, where recent FFT results have more influence on the average than older ones. As the text explains, the most recent measurement contributes most effectively to the average, while the older measurements have decreasing influence. This is particularly useful when monitoring a spectrum over long periods, where recent data might be more relevant to the current state than older data.

What is FFT Audio?

FFT (Fast Fourier Transform) applied to audio refers to the process of converting an audio signal from the time domain to the frequency domain. This transformation enables us to see the various frequency components (bass, midrange, treble, etc.) present in an audio signal at any given time. For instance, when analyzing a piece of music, an FFT will break down the signal to show how much energy exists at each frequency. This could reveal the low-frequency thump of a bass drum, the mid-frequency tones of a guitar, and the high-frequency sizzle of a cymbal, all at the same time.

FFT Audio Analyzer

An FFT Audio Analyzer is a tool or device that applies the FFT to audio signals, allowing users to visualize the frequency content of the signal. This visualization is often in the form of a spectrum, where the x-axis represents frequency (from low to high) and the y-axis represents amplitude (often in a logarithmic scale like dB). FFT Audio Analyzers are used in a range of applications:

  • Acoustics: Engineers can analyze the frequency response of a room and design acoustical treatments accordingly.
  • Audio Equipment Testing: Manufacturers can test the frequency response of their equipment, such as speakers and microphones.
  • Noise Analysis: Professionals can pinpoint and measure unwanted noises in various environments, from factories to quiet rooms.
  • Speech Analysis: Studying the frequency patterns in speech can be useful in fields such as linguistics and speech therapy.

Human Hearing and FFT Audio

The human range of hearing is generally considered to be from 20 Hz to 20,000 Hz (or 20 kHz). So, when an FFT Audio Analyzer is used to analyze audio signals meant for human consumption (like music or speech), the frequency spectrum will typically focus on this range. It’s worth noting that while we can hear in this range, our sensitivity to frequencies is not uniform. Humans are most sensitive to frequencies between 2 kHz to 4 kHz and less sensitive to very low and very high frequencies. An FFT Audio Analyzer will represent all frequencies based on their actual energy in the signal, not how humans perceive them.

Importance of Using FFT Windows

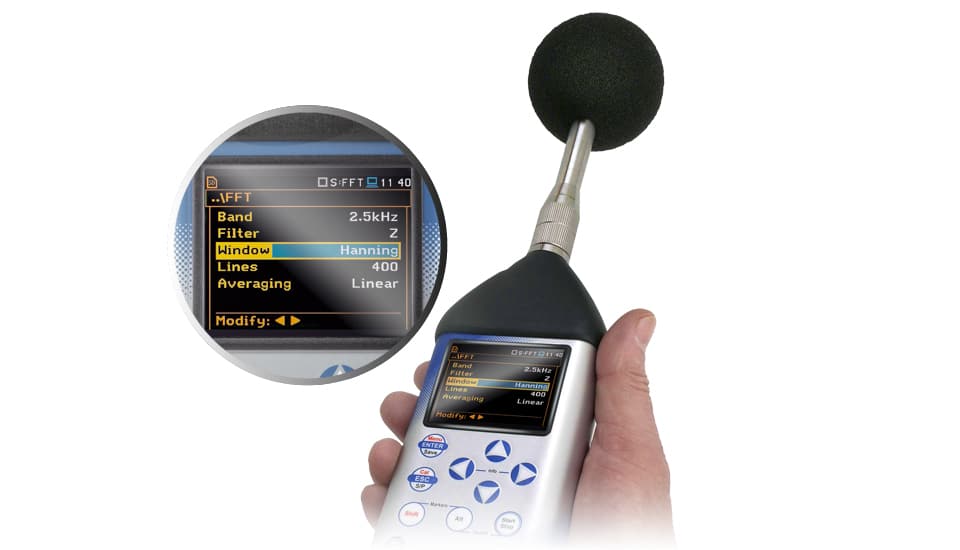
The use of windows is crucial when performing FFT-based measurements. Windows helps in mitigating certain issues inherent to the nature of FFT and the properties of the signals under analysis. A windowing function is a mathematical function that is applied to the signal to mitigate the effects of spectral leakage. Different windows have different properties, and the choice of window affects the outcome of the FFT analysis. The text mentions three specific types of windows:

  • Uniform (None): This is essentially a rectangular window, where no windowing function is applied.
  • Hanning (or Hann): This is a commonly used window that is a type of cosine window. It helps reduce the spectral leakage.
  • Flat Top: This window gives very precise amplitude measurements but has a broader main frequency lobe.

Different windows are suited for different scenarios.

  • For broad signal spectrums, the Uniform window is ideal. In many cases, the Hann window provides a good balance.
  • The Flat Top window is accurate in amplitude but poorer in frequency resolution.
  • For transient signals, specialized windows like the Force and Exponential are preferred.
Importance of Using FFT Windows​

FFT in Svantek Instruments

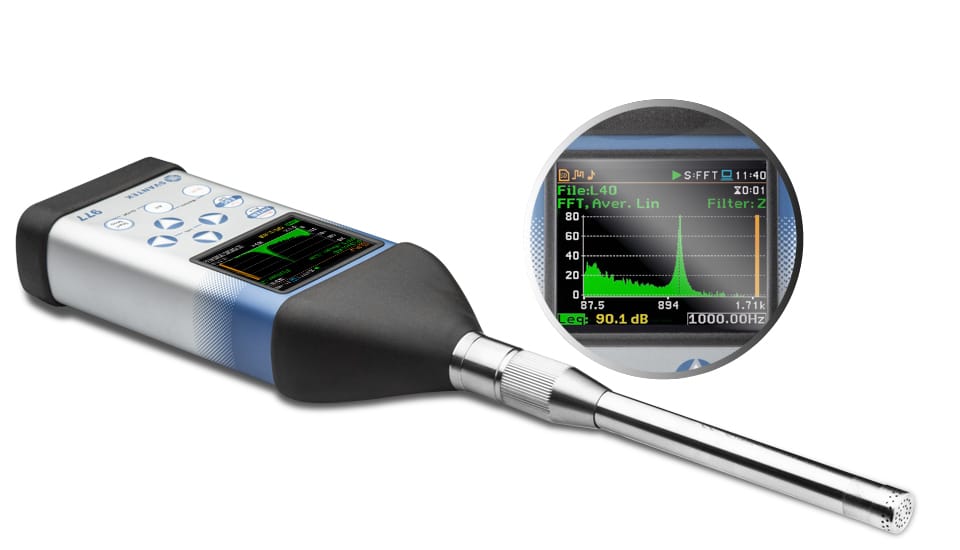
FFT in Svantek instruments enables users to understand the frequency components of sounds or vibrations they are measuring. This is crucial for various applications, including noise and vibration assessments, troubleshooting, and more. In Svantek instruments, FFT (Fast Fourier Transform) is a computational algorithm that transforms a signal from its original domain (time domain) into its constituent frequencies. It provides a means to analyze the distinct frequency components of signals, facilitating detailed insights into the characteristics of sound or vibration measurements. The FFT functionality in Svantek instruments operates in conjunction with their Level Meter and can display results as spectra in a dedicated Spectrum view.

  1. Operation & Display:
    • The Svantek instrument can operate as an FFT analyser in a manner similar to its Level Meter functionality.
    • The FFT analysis is conducted in parallel with SLM (Sound Level Meter) or VLM (Vibration Level Meter) measurements.
    • The results of the FFT analysis, termed as spectra, are shown in the Spectrum view. This view allows users to read spectrum values with the help of a vertical cursor.
  2. Configuration:
    • Users can configure various parameters for the FFT analysis. This includes selecting a frequency band, setting a pre-weighting filter, choosing a specific weighting window, determining the number of analysis lines, and deciding on an averaging type.
    • FFT spectra can be averaged over a designated Integration Period and saved according to the Repetition Cycles parameter.
    • The measurement range for FFT can be set to Low or High, and in vibration modes, results can be displayed in either absolute or logarithmic units.
  3. Logging:
    • The instrument supports the logging of FFT spectra in a logger file. This can be done in steps defined by the Integration Period or the Logger Step.
    • To log FFT spectra, the logging functionality must be enabled in the instrument.
  4. Display Modes & Presentation:
    • The instrument offers several display settings for the FFT results, allowing users to switch between different views, such as instantaneous, averaged, maximum, or minimum spectra.
    • For those using the instrument in vibration modes, they can select the type of vibration spectra to be displayed, which includes options like acceleration, velocity, or displacement.
  5. Tools:
    • The Spectrum position within the Display Modes enables or disables the view of the spectrum plot.
    • Users can also set the scale of the spectrum plot, defining the result units (linear or logarithmic) and adjusting the vertical axis.

Applications of Svantek’s FFT

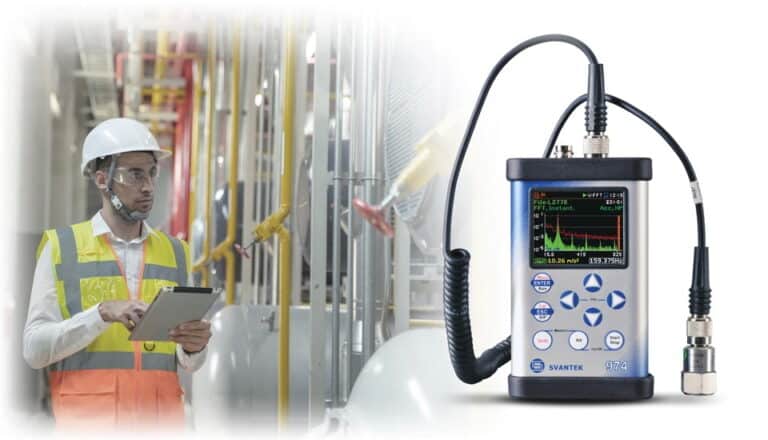
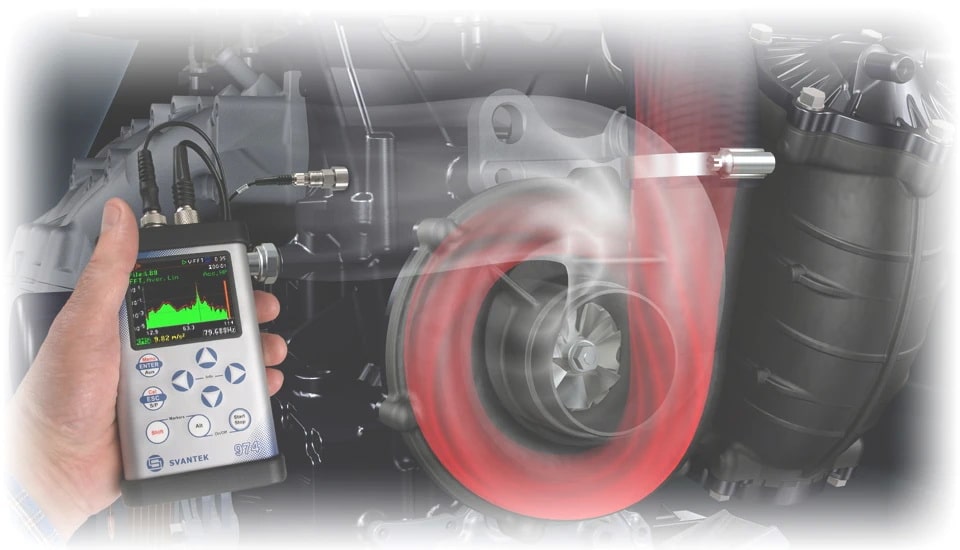
Svantek’s FFT capabilities are geared towards both acoustic and vibration analysis, making their instruments suitable for a variety of applications from environmental noise studies to industrial machine monitoring:

  1. Sound Level Measurement: Svantek instruments perform FFT analysis in parallel with Sound Level Meter (SLM) or Vibration Level Meter (VLM) measurements, allowing users to get detailed frequency information about sound or vibration signals alongside the overall level measurements.
  2. Vibration Analysis: The FFT function in Svantek instruments can be used in vibration modes, and users can switch between different representations like acceleration, velocity, or displacement. This makes it suitable for analyzing the vibrational characteristics of machines, structures, or other systems.
  3. Building Vibration: the FFT is used in accordance with DIN 4150-3 for indicating the dominant frequency of Peak Particle Velocity  
  4. Acoustic Analysis: With various weighting filters available (like A, B, C, and Z weightings), the FFT functionality in Svantek instruments can be used for detailed acoustic analysis.
  5. Spectrum View: The instruments offer a spectrum view for the results of the FFT analysis. This allows users to visually inspect the frequency components of the analyzed signal and understand their relative amplitudes.
  6. Logging: The FFT spectra can be logged in a logger file, making it suitable for applications where long-term monitoring and data recording are required. This can be especially useful in environmental noise studies, industrial monitoring, or any scenario where trends over time are of interest.
  7. Frequency Band Analysis: Users can select specific frequency bands for FFT analysis performance, from 20 kHz down to 78 Hz. This provides flexibility in zooming into specific frequency ranges of interest.
  8. Configurability for Different Analysis Needs: With options to configure parameters such as frequency band, pre-weighting filter, weighting window, number of lines, and averaging type, the Svantek FFT functionality can be tailored for various specialized applications.
fft in svantek instruments

FFT method in Building Vibration

The FFT method in building vibration  is described in German Standard DIN 4150-3. The method requires to perform FFT analysis for the Peak Particle Velocity (PPV), in the way that the middle of a FFT window is placed exactly on the PPV. The result of such analysis is the PPV value and its corresponding Dominant Frequency (DF) for each axis (X,Y,Z). Each pair of PPV and its DF are used as point coordinates that are compared with the limit curve.

Summary

FFT Fast Fourier Transform : Key Takeaways:

  1. FFT Fast Fourier Transform is an algorithm for efficient computation of the DFT and its inverse.
  2. DFT is used to transform signals into their frequency domain representation.
  3. FFT speeds up DFT computation, enabling real-time applications and large datasets.
  4. FFT was co-discovered by Cooley and Tukey in 1965, revolutionizing digital signal processing.
  5. FFT Applications cover mechanics, acoustics, biomedical engineering, signal processing, instrumentation, communications, and more.
  6. Benefits of using FFT include signal analysis, noise reduction, compression, filter design, and more.
  7. FFT converts signals from the time domain to the frequency domain and vice versa.
  8. Nyquist frequency is essential for accurate sampling, while anti-aliasing prevents errors in sampled data.
  9. FFT can be performed in real-time or post-processing, depending on the application.
  10. Averaging of FFT spectra enhances the signal-to-noise ratio for non-periodic signals.
  11. Different windows (uniform, Hanning, Flat Top) help mitigate spectral leakage in FFT analysis.
  12. Svantek Instruments utilizes FFT for sound and vibration analysis in various applications.

Ask for the price offer for
FFT Analyser


    Please indicate the subject of your enquiry:

    I hereby consent to the processing of my personal data, i.e. my full name and e-mail address, by SVANTEK SP. Z O.O. with its registered office in Warsaw at ul. Strzygłowska 81 for the purpose of receiving marketing information on the products and services offered by SVANTEK SP. Z O.O. via electronic means of communication, in particular via e-mail, in accordance with the provisions of Article 10 sec. 1 and 2 of the Act on providing services by electronic means.

    I hereby consent to the processing of my personal data, i.e. my full name and phone number, by SVANTEK SP. Z O.O. with its registered office in Warsaw at ul. Strzygłowska 81 for the purpose of marketing activities with the use of telecommunications terminal equipment and automatic calling machines within the meaning of the Telecommunications Act.

    I hereby consent to receiving from SVANTEK SP. Z O.O. with its registered office in Warsaw at ul. Strzygłowska 81, via electronic means to the e-mail address I have provided, the newsletter and marketing information on the products and services offered by SVANTEK SP. Z O.O., within the meaning of the Act on providing services by electronic means.


    I declare that I have been informed that my data may be transferred to entities that process personal data on behalf of the Administrator, in particular to distributors - such entities process data on the basis of an agreement with the Administrator and exclusively in accordance with its instructions. In such cases, the Administrator requires third parties to maintain the confidentiality and security of information and verifies that they provide appropriate measures to protect personal data.

    Some of the entities processing personal data on behalf of the Administrator are established outside the EEA. In connection with the transfer of your data outside the EEA, the Administrator verifies that these entities provide guarantees of a high level of personal data protection. These guarantees stem in particular from the obligation to apply the standard contractual clauses adopted by the Commission (EU). You have the right to request a copy of the standard contractual clauses by sending a request to the Controller.

    I declare that I have been informed on my right to withdraw my consent to the processing of my personal data at any time, to access the provided personal data, to rectify, erase, restrict processing and object to the processing of my data, as well as the right to lodge a complaint with the President of the of the Personal Data Protection Office in the event of an infringement of the provisions of GDPR.

    svantek consultant

    An authorized SVANTEK consultant will help You with the details such as the required accessories for your noise & vibration monitoring task.

    processing...