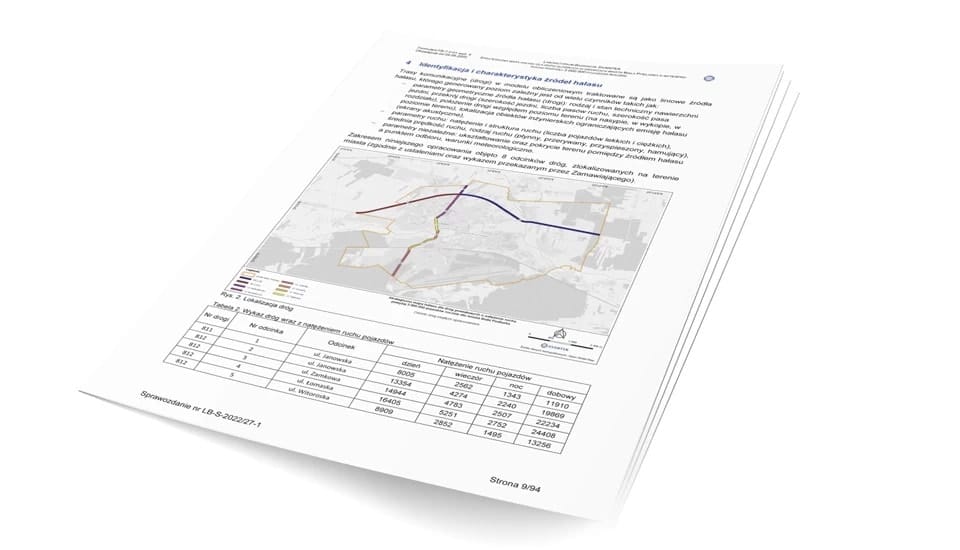
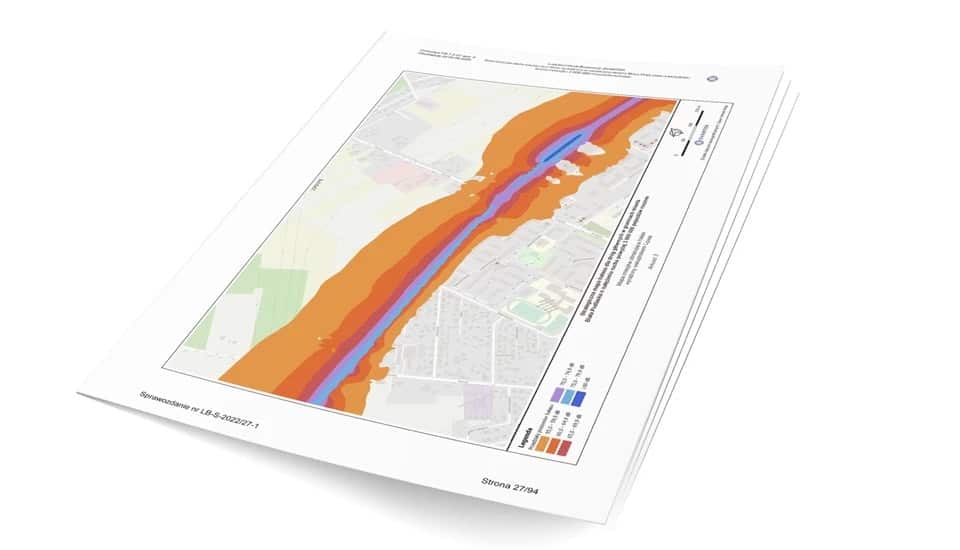
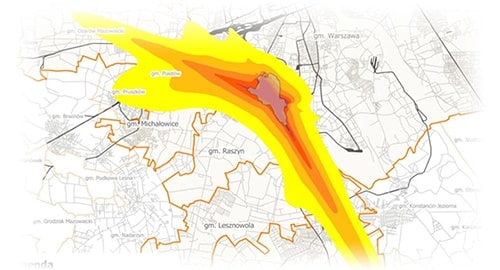
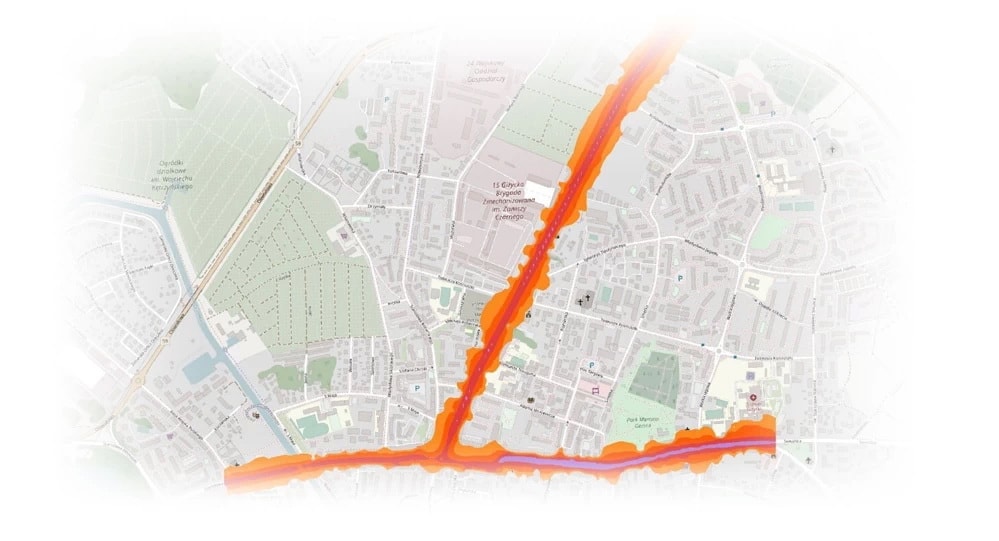
A noise map is created for cities with populations of more than 100,000 major roads, airports, and railroads.
Strategic noise maps are created in accordance with the Environmental Protection Law for cities with populations over 100,000, major roads, airports, and railroads. This makes it possible to inform the public about noise pollution or to make changes related to noise protection in a given area. The content collected in strategic acoustic maps always refers to the previous calendar year.
The noise map created is valid for 5 years following Directive 2002/49/EC of the European Parliament and the Council on June 25, 2002. The directive introduced the obligation to create strategic acoustic maps and develop noise protection programs.


Noise maps are increasingly being used by cities to identify and address noise pollution in their territories. These maps allow cities to visualize the distribution and intensity of noise across different areas, allowing them to identify areas where noise levels are exceeding acceptable limits. To address this issue, cities are implementing a variety of strategies such as including acoustic conditions in their local zoning plans and establishing procedures for dealing with excessive noise levels. Some cities also have regulations in place requiring businesses and other sources of noise to keep their levels below certain thresholds. By using acoustic maps and implementing these strategies, cities are working to reduce the generation and spread of noise and improve the quality of life for their residents.
The use of noise maps has revolutionized the way cities approach noise pollution. By providing detailed, data-driven insights into the distribution and intensity of noise across different areas, acoustic maps have made it possible for cities to proactively monitor and address nuisance noise. These maps not only help cities combat existing noise problems, but also allow them to anticipate and prevent noise generation, as well as track changes over time. Additionally, acoustic maps can be used for a variety of purposes, including environmental monitoring, strategic planning, and urban development. In short, noise maps are a powerful tool for improving the quality of life in cities.

It is necessary that they consist of a descriptive part and a graphic part. The descriptive part includes information about the sources of noise, the area, the measurement method, the figures obtained in the measurements. The final summary of the descriptive part also includes an analysis of the measurements made, and in particular determines the noise-prone areas, how large a percentage of the population is exposed to noise in the area, what is the distribution of noise. The unification of the content of strategic maps is important for further comparisons between them. When maps are created in a standardized way, it is possible to juxtapose cities, roads or airports with each other and assess the overall acoustic climate

Noise maps are a valuable tool for understanding and addressing noise pollution in cities. These maps consist of a graphic representation of measurement data, including emission maps, immission maps, and maps of noise-prone areas. By visualizing this data, acoustic maps provide a clear and detailed picture of the distribution and intensity of noise in different areas. This information is essential for identifying and addressing noise problems, as well as for planning and development purposes.
A noise map should consider all public roads, railroads and tramways, airports, ports, and industrial sites within the city limits. The descriptive part should include accurate data of the entity making the map, characteristics of the area and noise sources, parameters of airports and the air fleet, lists of industrial plants, large commercial facilities, as well as parking lots with more than 300 parking spaces and ports for ships of at least 1350 tons. The map should also include permissible noise levels for each site, measurement methods used to develop the map, detailed measurement results, and calibration of the calculation model. The conclusions should include an indication of the areas at risk and the number of people exposed to noise, an analysis of the directions of changes in the acoustic state of the environment, and the results of noise distribution analyses. As in the previous case, the map must propose measures to protect against noise and the estimated effect of these measures. In addition, there should also be a summary of the descriptive part in a non-specialist language.
The graphic part includes 7 noise maps: an emission map for roads and railroads, an immission map that characterizes the general state of the environment with noise levels, a map of areas under acoustic protection, a map of noise-prone areas where the permissible noise level is exceeded, maps with the results of activities, a map of the city limits and a population map.
The noise map should include details of the mapping entity, characteristics of the area, and identification of noise sources with detailed information. As in the case of large cities, the maps should include information on acoustic conditions, measurement, and calculation methods. The results should consist of noise measurements and calibration of the calculation model. In addition, the map must be accompanied by an analysis of the measurements – the designation of areas at risk, an indication of the population and number of dwellings exposed to noise exceedances, as well as the area of areas exposed to noise. The acoustic map should propose protection measures and estimate the effects of these measures. Identical to large cities, a summary should be prepared in a non-specialist language.
The graphic part for traffic noise should include at least 5 maps: an emission map for roads and railroads, an immission map that characterizes the state of the environment, a map of protected areas, a map of endangered areas, and maps with the result of activities. Noise maps must be at the right scale and with the right colors.

The effect of such a map is additionally to plan the measures that can be implemented for noise protection and the expected effect of these measures. In connection with the presentation of the planned measures, a map with the expected results is also created. Places that are likely to generate more noise, such as communication lines, ports, airports or facilities where industrial activities are carried out are covered by additional maps.
Strategic noise maps are the starting point for creating a noise protection program. The program includes measures introduced, planned for the next 5 years, and long-term plans. In addition, the program also identifies areas of quiet areas. Environmental Protection Agency is responsible for creating the acoustic maps, while the regional agencies are responsible for developing the noise protection program. Further, this program is submitted to the European Commission.


The noise protection program performs calculations of long-term indicators, which at a further stage allows determining of the total number of people affected by the harmful effects of noise. Acoustic maps provide three indicators – significant annoyance, significant sleep disturbance, and ischemic heart disease.
For roads and railroads, the daily traffic volume averaged over the previous calendar year is determined in the strategic acoustic map for the purpose of the emission map. The immission map characterizes the acoustic state of the environment. The measurement is made 4 meters above ground level and is expressed by the LDNW or LN index. To determine the LDWN index, the following formula is used:


The results of the measurements are shown on the maps using color. Quiet areas with noise levels of less than 50 dB are marked in yellow, while those most affected by noise above 80 dB are marked in dark blue.
It is worth considering here that, according to WHO recommendations [Guidelines on community noise 1999], the safe noise level during daytime is a maximum of 50-55 dB, while during nighttime it is 40-45 dB.