

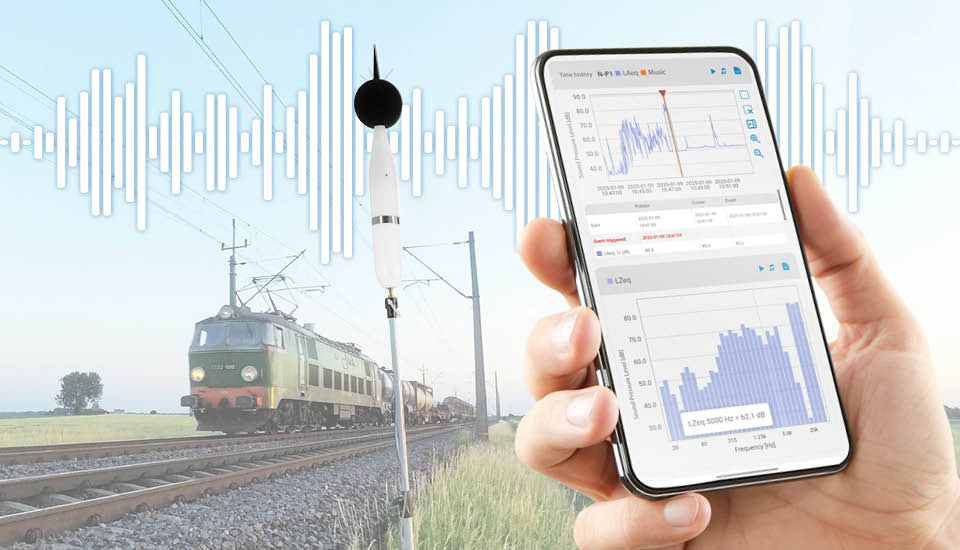
Railway noise measurement records the sound a train makes — for the people it passes and for the passengers on board — as a level in decibels. That level only means something when it is tied to a defined standard, microphone position, and time base. It turns a complaint about a noisy train into evidence that can be checked against a legal limit, a type-approval threshold, or a design target. The measurement serves three groups: regulators who approve new trains, consultants who assess a line, and manufacturers who build quieter rolling stock. The path from source to result runs in a fixed order — where the noise comes from, why it is measured, which limits apply, how it is measured, how the results are read, and how ground vibration travels alongside it.
The dominant railway noise source changes with the train’s speed. Rolling noise leads through the ordinary range, aerodynamic noise takes over above about 250 km/h, and auxiliary equipment leads at standstill, so speed decides which source — and which part of the spectrum — a measurement must target.
Emission and immission measurements answer two different questions. A train within its type-approval limit at 7.5 m can still create a problem for a community measured at the facade, because the two are taken at different places and judged against different limits.
The same railway noise yields different valid results under different standards. ISO 3095, TSI Noise, and the Environmental Noise Directive each fix their own positions, indicators, and limits, so the first step in any assessment is to establish which standard governs the case.
Railway noise is judged by both single-event and long-term indicators. Event indicators (LpAFmax, SEL) describe one pass-by and cumulative indicators (LAeq, Lden, Lnight) describe the year-round climate, so an annual average within its limit can still hide loud night pass-bys that wake residents.
Trains also generate ground-borne vibration that turns into noise inside buildings. The wheels and track shake the ground, which re-radiates indoors as a low-frequency rumble, so it is measured on its own terms (PPV, VdB) and matters most for tunnels and lines close to homes.
A railway noise measurement begins by identifying the governing source, because a train produces several distinct noise mechanisms whose dominance changes with speed and operating state. At the same microphone position, each source shows a different level and spectrum, so naming the dominant one makes the reading interpretable.
The three speed-dependent sources each lead in their own regime, which is why type-testing measures constant-speed pass-by, acceleration, and stationary conditions separately rather than as one figure.
| Source | Dominant regime | Character and control |
|---|---|---|
| Rolling noise | ~50–250 km/h (30–155 mph) | Broadband; wheel/rail roughness; controlled by grinding, dampers, wheel profiles |
| Aerodynamic noise | above ~250–350 km/h (155–220 mph) | From pantograph, bogies, inter-coach gaps, leading nose |
| Traction & auxiliary systems | low speed and standstill | Motors, cooling fans, gearboxes, compressors |
In practice a train speeding up from 50 to 100 km/h (about 30 to 60 mph) produces roughly 9 dB louder — close to a doubling of perceived loudness. Rolling noise sets the broadband baseline against which discrete events stand out. Aerodynamic noise grows so steeply that it governs high-speed lines, and the traction and auxiliary systems — motors, cooling fans, and compressors — govern the stationary case.
Several mechanisms produce sound concentrated in time or frequency, audible against the broadband rolling baseline:
Each of these carries a specific signature — tonal, impulsive, or band-limited — that shows up in the frequency spectrum rather than in the broadband level alone.
Railway noise reaching a community also comes from sources that never move, including depots, marshalling yards, maintenance workshops, traction substations, and tunnel ventilation plant, many of which run through the night. Idling and parked trains add to this stationary contribution and are governed by dedicated standstill limits rather than by pass-by criteria. Because these sources run continuously and close to homes, they frequently dominate the night-time acoustic climate, even where pass-by events are rare. A complete assessment therefore measures the fixed installations alongside the traffic.

Railway noise is measured because it disturbs people living near a line — mainly through annoyance and, at night, disturbed sleep — and because a vehicle or route can breach the limits set in law. Across Europe, it is the second most widespread source of transport noise, after road traffic. That scale of exposure is why it is so closely regulated. A measured level lets an operator show that a route stays within its community limit and lets a manufacturer show that a vehicle meets its type-approval limit. These two checks happen in different places—the vehicle for approval and the receiver for community exposure—so every measurement is tied to a defined position and time. The two questions that follow set that basis: how much the sound affects the people exposed to it and how it travels from the wheel to the window.
Prolonged exposure to railway noise affects residents through annoyance, disturbed sleep, and — at sustained high levels — an elevated cardiovascular risk. Environmental limits therefore target the receiver, not the vehicle alone. The World Health Organization identifies night-time exposure as the most sensitive period, because sound events during sleep make a given level more disruptive than the same level heard by day. Railway traffic contributes a distinctive pattern of discrete pass-by events separated by quiet intervals, rather than the continuous flow typical of road traffic, so the timing and number of events matter as much as the average level. Inside the vehicle, passengers form a second exposed group, and interior noise measured under ISO 3381 (measurement of noise inside railbound vehicles) becomes an acoustic comfort parameter that manufacturers specify and verify. Measured at the receiver, exposure becomes evidence that a limit is met or exceeded — the practical purpose of the whole measurement chain.
Railway noise travels from the track to the receiver along paths whose attenuation determines where a meaningful measurement can be taken:
These paths are the reason a measurement position must be defined precisely: the applicable emission standard fixes both the distance from the track and the height above the rail.
Railway noise limits come from a layered system of standards that separates what a vehicle may emit from what a community may receive. Emission standards cap the sound a vehicle produces, measured at a fixed 7.5 m from the track, so type approval rests on a repeatable figure rather than a field opinion. Environmental standards work at the receiver—the building facade — where national regimes set the indicators and thresholds a line must respect in service. The same sound pressure underlies both layers, yet the vehicle and the receiver are measured separately, each against its own limit, so the first step in any assessment is to establish which standard governs the case.
Emission limits govern the sound a railbound vehicle produces, measured by the common method of ISO 3095, the international standard for railbound-vehicle noise. In Europe they are capped by the Technical Specification for Interoperability relating to noise (TSI Noise), Commission Regulation (EU) No 1304/2014.
ISO 3095 fixes how pass-by, stationary, and starting noise are measured, so a result from one test site compares directly with a result from another. The regulation expresses the pass-by requirement as a single limit for the whole unit rather than separate caps on each component, which lets the manufacturer balance sources across the vehicle.
The limits are set per category as the A-weighted sound level averaged over the pass-by, written LpAeq,Tp. Here Tp is the pass-by time fixed by the standard—the interval during which the train passes the microphone, from the front reaching the position to the rear leaving it—not a window the operator chooses. Because the level averages energy over that fixed window, extending the capture into the quiet before or after would lower it, which is why the sound exposure level (SEL) is used when a window-independent figure is needed. Each pass-by limit is normalized to a reference speed of 80 km/h (about 50 mph) through the relation −30·log₁₀(v/80), where v is the test speed—the same speed law that governs rolling noise:
| Vehicle category | Pass-by limit LpAeq,Tp at 80 km/h [dB(A)] |
|---|---|
| Coaches | 79 |
| Electric multiple units (EMU) | 80 |
| Diesel multiple units (DMU) | 81 |
| Wagons | 83 |
| Electric locomotives | 84 |
| Diesel locomotives | 85 |
At higher reference speeds the allowance rises with the same law, so a high-speed unit is checked near 250 km/h (about 155 mph) rather than at 80 km/h.
EuroSpec tightens the limits below the regulatory ceiling
Several national operators procure stock against EuroSpec, a voluntary specification below the TSI ceiling. Operators including DB, SNCF, NS, and SBB use it to specify quieter vehicles than the regulation alone requires. Because EuroSpec is a procurement instrument rather than a legal limit, the measurement demonstrates conformity to a contract specification rather than to type-approval law.
Stationary and interior noise carry their own limits, set separately from the pass-by figure because the operating condition and the exposed population differ. The TSI sets standstill limits by vehicle category, as the A-weighted level averaged over the measurement time (LpAeq,T), reflecting the auxiliary equipment each category runs while parked:
| Vehicle category | Standstill limit LpAeq,T [dB(A)] |
|---|---|
| Coaches | 64 |
| Wagons | 65 |
| Electric multiple units (EMU) | 65 |
| Electric locomotives | 70 |
| Diesel locomotives | 71 |
| Diesel multiple units (DMU) | 72 |
The TSI standstill limit is set per vehicle category. EuroSpec adds a further condition — the declared power mode the vehicle runs while parked — so a EuroSpec result states that mode alongside the category. Interior noise is a separate case, measured inside the vehicle under ISO 3381 against a contractual target in the low 60s dB(A).
Each jurisdiction sets its own indicators, thresholds, and reference positions for railway noise — most judged at the receiver, though the US federal standard is an emission limit at a fixed distance:
| Regime | Indicator / method | Applies to |
|---|---|---|
| EU — Environmental Noise Directive 2002/49/EC | Lden (day–evening–night level), Lnight (night level); strategic noise maps | Major railways in EU member states |
| US — 40 CFR Part 201 (EPA), enforced under 49 CFR Part 210 (FRA) | Emission limits at 30 m (about 100 ft) from the track | Locomotives and rail cars |
| Germany — 16. BImSchV with Schall 03 | Beurteilungspegel (rating level), separate day and night limits | New and substantially altered lines |
| UK — Calculation of Railway Noise (lines); BS 4142 (fixed installations) | LAeq for lines; rating level vs LA90 background for fixed installations | Rail lines and lineside equipment (substations, depots) |
| Poland — environmental-noise regulation | LAeqD (day) and LAeqN (night) limits by area class | Long-term limits at the receiver |
| China — GB 3096 | Daytime and night-time LAeq (Ld / Ln) by function zone | Community noise (general environmental standard) |
The physical quantity is identical across these regimes, yet the chosen indicator, reference position, and numerical limit vary. The indicator, position, and threshold take their meaning from the regime that sets them, so the governing regime is settled before any measurement begins.
Railway noise measurement follows a defined procedure that binds three variables together: the instrument that records the sound, the position at which it stands, and the operating condition of the train. A pass-by figure means one thing only when the microphone sits at the distance and height the standard prescribes and the train runs at the reference speed the method requires. A measurement earns its authority from the procedure behind it — the instrument, the position, and the operating condition the standard fixes. The same sound is then characterised one way for the vehicle (emission) and another for the receiver (immission), because each follows a different procedure.
Emission measurement records the sound a vehicle makes under conditions controlled tightly enough that another laboratory gets the same result. ISO 3095 provides the reference method. The distance is set by the standard, not by the operator. ISO 3095 and the European TSI place the microphone 7.5 m (about 25 ft) from the track centre; the US 40 CFR Part 201 measures at 30 m (about 100 ft).
The 25 m distance sometimes cited for railway noise belongs to environmental prediction methods, not to the ISO 3095 emission test.
Immission measurement records railway noise at the facade of a building rather than beside the track. The long-term indicators Lden and Lnight express this exposure over a year, so the measurement runs for extended periods or feeds a calculation calibrated against sample measurements. Unattended monitoring stations capture the pattern of pass-by events and the intervals between them, which matters because railway exposure arrives as discrete events rather than a steady flow. An immission result is taken at the facade and averaged over a long period. It is checked against its own environmental limit, while the 7.5 m emission figure answers to the vehicle’s — the two stay separate.
Compliance measurement reports the A-weighted level and, where the standard calls for it, a one-third-octave band analysis using IEC 61260 filters. The spectrum reveals tonal or impulsive features — a curve-squeal peak, a rail-joint impact — that a single broadband figure hides, and ISO 3095 allows these to be determined alongside LpAFmax. Pinpointing which part of a train is the dominant source is a separate engineering investigation rather than part of a compliance test, and it uses specialised array methods outside the standard microphone positions.
Railway noise measurement reports its result as an indicator — the specific quantity a limit refers to — and interpretation compares that indicator against the right threshold. A single railway noise level supports a decision only once its indicator, position, and time base are fixed. The same sound yields a maximum level, an energy exposure, or a yearly average, depending on which quantity the assessment asks for. The same sound can pass one limit and fail another, so the indicator fixes which comparison is the legitimate one.
Railway noise arrives as discrete pass-by events, not a steady flow. Its measurement uses two main families: event indicators for a single train and cumulative indicators for the long-term climate, plus statistical measures such as LA90 for the background.
| Indicator | Class | What it captures |
|---|---|---|
| LpAFmax | Event | Highest A-weighted level during one pass-by (Fast time weighting) |
| SEL (LAE) | Event | Energy of one event, normalised to a reference of 1 s |
| LAeq,T | Cumulative | Average acoustic energy over the period T |
| Lden / Lnight | Cumulative | Year-long exposure; Lden adds evening and night weighting (EU) |
| Ldn | Cumulative | US day–night level, with a 10 dB night weighting |
| LA90 | Statistical | Background level exceeded 90% of the time; the residual level a rating is judged against |
SEL sums the energy of a single event instead of averaging it against silence, so a short loud pass-by and a long quieter one can share the same value. Lden adds a policy weighting before averaging: 5 dB for the evening and 10 dB for the night. That night weighting is a policy judgment that night noise weighs more for sleep, not a physical rise in what the train emits — a night event is counted as if ten daytime ones. The World Health Organization Environmental Noise Guidelines recommend railway thresholds of Lden below 54 dB and Lnight below 44 dB.
Interpretation compares a measured value with a limit only when the two share the same indicator, position, and time base. A maximum level cannot be checked against an energy average, and an emission figure at 7.5 m from the track cannot be checked against an immission limit at a facade, because each describes a different quantity. Two kinds of decibel must also stay apart: doubling the energy, the number of equal events, or the duration adds 3 dB, which is physics, whereas adding 10 dB to the night is a policy weighting. Mixing the two in one calculation misstates both. A site can meet the cumulative average while single night events still exceed a disturbance threshold, which is why a thorough assessment reports event and cumulative indicators together.
Railway measurement extends beyond airborne sound to the ground-borne vibration a train transmits through the track and soil into nearby structures. Vibration is a distinct physical quantity, measured as velocity or acceleration rather than sound pressure, so it uses its own descriptors, transducers, and limits. It reaches the receiver through the ground — a path that only ground sensors register. Vibration splits into two effects, both judged per event rather than by yearly averages: the movement occupants feel, and the rumble that starts once that movement reaches indoor surfaces.
The tactile movement is quantified with velocity-based descriptors alongside frequency-weighted acceleration:
| Descriptor | Quantity | Typical use |
|---|---|---|
| PPV | Peak particle velocity (mm/s, in/s) | Building-damage and perception thresholds |
| RMS | Frequency-weighted r.m.s. acceleration (m/s²) | Whole-body human response (ISO 2631) |
| VdB | Velocity level re 1 microinch/s (US) | Human-response criteria, e.g. ~72 VdB at residences |
| VDV | Vibration dose value (m/s^1.75) | Fourth-power dose; weights impulsive events (UK, BS 6472) |
A vibration level in decibels depends entirely on its reference. The velocity decibel (VdB) is a US convention, referenced to 1 microinch per second in FTA practice, whereas the SI reference is 10⁻⁹ m/s — the two differ by about 28 dB, so the reference travels with the number. Human-response criteria use this VdB scale, and building vibration is assessed under ISO 2631-2 over the 1–80 Hz range; the FRA and FTA allow higher levels for occasional events and less sensitive land uses. Building-damage criteria instead use peak particle velocity (PPV) in mm/s or in/s under DIN 4150-3 and BS 7385-2 — a separate, higher threshold aimed at structures rather than people.
Ground-borne noise is the sound that radiates from floors and walls when ground-borne vibration excites those surfaces inside a building. The mechanism produces a low-frequency rumble instead of the broadband spectrum of airborne railway noise, and it becomes the dominant concern when the track runs in a tunnel and the airborne path is sealed off. The FTA expresses its limits as an interior ground-borne noise level in A-weighted decibels, for example, around 35 dBA for frequent events at residences, kept separate from the VdB vibration criterion because the two describe different effects. Underground and street-running railways drive this assessment most often, since the vibration couples directly into building foundations along the route.
Measuring railway noise and vibration to these standards calls for instruments of a defined class, matched to the quantity and position each method fixes. The instrument type follows directly from the standard, so each requirement points to a specific instrument class rather than a general-purpose device:
| Measurement requirement (standard) | SVANTEK instrument | Role |
|---|---|---|
| Class 1 sound level meter (IEC 61672-1), 1/1 & 1/3 octave analysis (IEC 61260) | SVAN 979, SV 971A | Pass-by and emission measurement under ISO 3095 |
| Unattended long-term noise monitoring, Lden/Lnight (END 2002/49/EC) | SV 307A, SV 200A | Immission monitoring at the receiver, streamed to SvanNET |
| Whole-body human vibration (ISO 2631, ISO 8041) | SV 106D, SV 100A | Vibration exposure of passengers and staff |
| Ground-borne building vibration, PPV (DIN 4150-3, BS 7385-2) | SV 804, SV 803 | Trackside and structure vibration monitoring |
| Analysis and reporting | SvanPC++, SvanNET | From recorded data to the compliance report |
The building-vibration stations report peak particle velocity against DIN 4150-3 and BS 7385-2, while human whole-body exposure is assessed separately under ISO 2631.
Railway noise and vibration measurement raises a few recurring points of confusion.
SEL captures the energy of a single pass-by, normalized to one second, so two events of different lengths compare on equal terms. Leq averages the acoustic energy across a whole period, describing the climate that many events create. The first quantifies an event, while the second quantifies exposure over time.
Measurement records sound pressure in decibels at a defined position, such as 7.5 m from the track under ISO 3095. Sound power describes the total emission of the source and is derived from pressure measurements rather than read directly at the wayside. A limit therefore refers to sound pressure at a stated position, not to source power.
PPV records the single largest velocity peak, which governs building-damage thresholds. RMS expresses the time-averaged energy of the same signal. How far the peak rises above the average depends on the waveform, so the two describe different aspects of one vibration.
An emission limit at 7.5 m certifies the vehicle under controlled conditions, while an immission limit at a building facade governs community exposure through Lden and Lnight. Each applies only to its own quantity and position, so a measured value is checked against the limit that shares its indicator, position, and time base.
An authorized SVANTEK consultant will assist you with noise and vibration measurement issues.
